&imwidth=800&imheight=600&format=webp&quality=medium "Who’s reading the US midterms 2026 correctly? Markets, models and polls tell different stories")
The upcoming 2026 US midterm elections are entering their final stretch, but there is no single way to measure where the contest stands. Prediction markets such as Kalshi and Polymarket are continuously updating their prices based on what traders think will happen. Polling averages measure where voters currently stand. Silver Bulletin's FLIPR model combines polling with political fundamentals and expert race ratings to simulate possible outcomes. The Cook Political Report and Sabato's Crystal Ball, meanwhile, assess individual races using expert judgment and competitiveness ratings. All are looking at the same election. Yet they can produce noticeably different pictures. That difference is not necessarily a contradiction. The systems are answering different questions, using different inputs and operating on different timelines.
Prediction markets: What are traders pricing in?
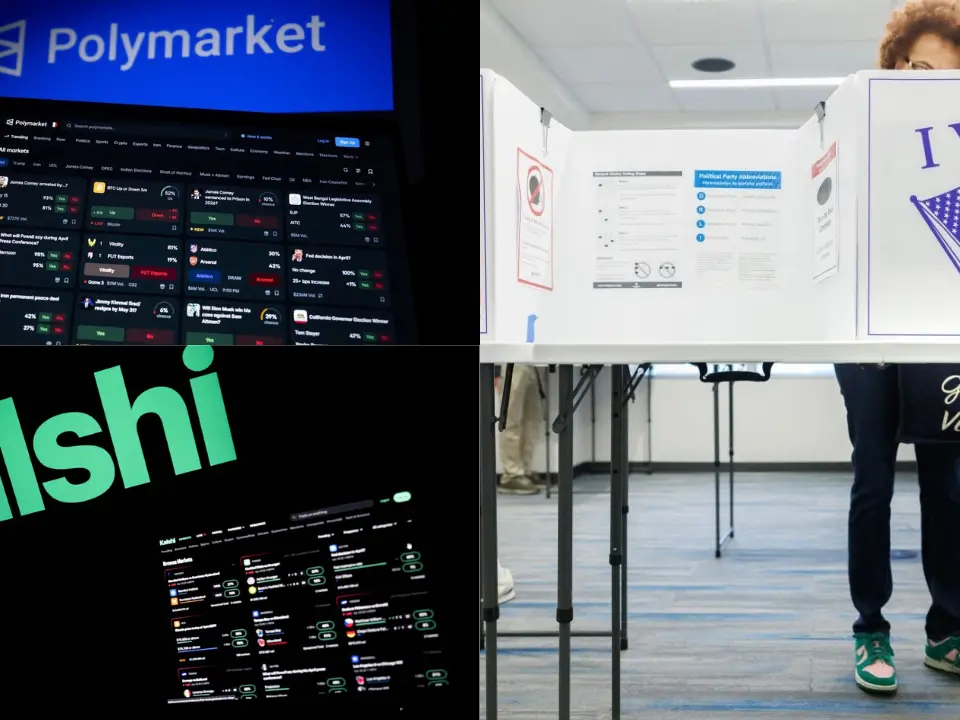
Kalshi and Polymarket approach elections through prediction markets. Rather than asking voters directly, they provide markets in which participants trade contracts tied to future outcomes. Kalshi's own September 21 overview said traders had moved toward pricing Democratic control of both chambers, while stressing that market expectations can change as polling and campaign developments emerge.

Polymarket similarly expresses expectations through market prices. Its markets can cover everything from control of the House and Senate to individual races and broader election scenarios. A contract priced around 60 cents, for example, can be interpreted as the market assigning roughly a 60% implied probability to that outcome, subject to the market's rules and liquidity. That makes prediction markets different from polls.
A poll asks voters what they currently intend to do. A prediction market asks traders to put a price on what they believe will happen on Election Day. The distinction can become particularly important when a major development occurs. A new poll, debate performance, candidate controversy or economic development can move market prices before a large batch of new public polling becomes available. But market prices are not guaranteed forecasts. They reflect the participants, information and trading conditions in that particular market.
Silver Bulletin: Turning polls and fundamentals into simulations
Trending Stories
)
US vs China over South China Sea: Washington backs Philippines, Beijing hits back
)
Bigg Boss 20: Isha Rikhi evicted after three weeks in Salman Khan’s show
)
Musk plans to more than double xAI's chips to over 1.2 million Nvidia GPUs by year-end
)
After JU, clash erupts at SRFTI: BJP’s ‘Dimagi Naxal’ jibe sparks political firestorm after students protest RSS-linked event
)
‘Anti-social elements spreading false rumours’: LPU issues statement amid massive unrest over alleged rape
)
LPU students go on rampage, vandalise campus amid widespread protest: What's happening
)
Trump asked Xi to pressure Iran. China did not say yes — here’s what Beijing wants
)
US Treasury Secretary Scott Bessent hails global crackdown on Iranian banks and airlines
)
An OpenAI agent escaped its locked test cage again, by hiding questions in DNS lookups
)
'Our video was trimmed': LPU girls who featured in rape-denial video make U-turn
)
3 males killed, four others injured in shooting after fight at strip club in Detroit
)
'Victory for low-budget consumers': Raghav Chadha hails 30-day telecom recharge rules
)
Claude rebuilt the 1989 game 'Prince of Persia' by reusing the original's own code
)
Beyond metros: How Tier-2 and Tier-3 cities could drive India’s next AI wave
)
Tesla builds first Cybertruck with its own refined lithium: Elon Musk's $1 billion Texas bet pays off
)
IndiGo flight suffers tail strike in Bengaluru while landing; DGCA to probe incident
)
The US and China set up an AI 'red telephone', but skipped the rulebook
)
‘Terror suspects arrested near UK air base were looking to do big damage’: Trump
)
Russian envoy claims US tactics to contain India were revealed in ‘Freudian slip’
)
IND vs WI 1st ODI: Kohli breaks Sachin's most runs in one country record with unbeaten 139 as India thump West Indies by 8 wickets
)
Researchers rebuilt exactly how 700 AI agents hacked Hugging Face: a 900-link chain trick
)
‘Olympic inclusion is our major target’: WPA President Ishaun Singh on pool’s global ambitions
)
Nations League: Spain sink England at Wembley; Modric shines for Croatia
)
Why has Iran released no proof of life of Mojtaba Khamenei? Araghchi reveals...
)
'What kind of confession is this?': Pakistan PM Shehbaz Sharif’s 'terrorists would be roaming New York' remark goes viral, raises alarm online. Watch
)
South Korea demands apology from Ukraine over North Korean prisoners' transfer
)
Beyond BrahMos: India targets Rs 50,000 crore in defence exports with unmatched price edge
)
Sri Lankan Tamil migrant worker gets death sentence in Saudi Arabia, help sought from India
)
Muslim marriage cannot shield sex with minor wife from prosecution under POCSO: Delhi HC
)
'Can't help but draw painful parallels to Nirbhaya case': SC on latest incidents of rape cases in Delhi-NCR
)
99.9% more powerful - Scientists find boy who can recall memories from just 3 months of age
)
'FIRST LOOK from inside Noah’s Ark': Researchers share video from inside mysterious mound in Turkey
)
UNSC reform momentum grows: Russia, Portugal, Mauritius push for India's permanent seat bid
)
8 US marines injured in Iranian missile attack on vessel in Strait of Hormuz: Report
&im=FitAndFill=(700,400))
New OTT releases this week (September 28-October 4, 2026): Dupahiya 2, Pooja Meri Jaan, Ohh My Dog- 5 titles coming on Netflix, Prime Video and more
)
Afghanistan says 28 fighters killed in clash near Pakistan border, Islamabad denies
)
Ceuta migrant crisis: Protesters take to streets as Spain grapples with migrant challenge
)
LPU suspend classes, postpones exams as violence escalates over rape claims: What's happening
)
New York City wants a 'kill switch' on every AI, and will pay whistleblowers who report violations
Silver Bulletin takes a more traditional modelling approach, although its FLIPR system is considerably more than a simple polling average. FLIPR, short for Forecast with Leading Indicators, Polls and (Expert) Ratings, combines polling, non-polling fundamentals and outside expert ratings. The model then runs thousands of simulations to estimate the range of possible congressional outcomes.
Its September 28 update showed Democrats with a 9.2-point advantage in its likely-voter-adjusted generic congressional ballot average. The model also had Democratic candidates holding polling leads in six Senate states it identified as particularly important to the Senate tipping point: Texas, Maine, Ohio, Iowa, Michigan and Alaska. That does not mean FLIPR simply takes a 9.2-point national lead and converts it into seats.
The model accounts for the fact that congressional races are interconnected but not identical. It uses individual race polling, candidate and incumbency factors, the national political environment and other fundamentals. That is one reason a model can produce a different result from a prediction market even when both are looking at broadly similar political developments. Silver Bulletin's methodology notes that FLIPR typically uses 40,000 simulations and models House, Senate and gubernatorial elections jointly.
Cook Political Report: The race-by-race approach
The Cook Political Report uses another framework altogether. Rather than presenting every race as a probability, Cook classifies contests on a seven-point scale: Solid Democratic, Likely Democratic, Lean Democratic, Toss Up, Lean Republican, Likely Republican and Solid Republican. Cook says its ratings consider factors including a state's political makeup, candidate strengths and weaknesses, and the political environment at both the state and national levels.
As of September 29, Cook's Senate ratings had seven races classified as Toss Ups: Alaska, Iowa, Maine, Michigan, New Hampshire, Ohio and Texas. That is useful information, but it should not be read as equivalent to a prediction-market probability. A Toss Up means Cook considers the race highly competitive; it does not mean the race is mathematically 50-50. This is an important distinction when comparing election coverage. A headline that places a ‘Toss Up’ next to a market's 55% or 60% probability can make the two systems appear to disagree more than they actually do.
Sabato's Crystal Ball: Another expert lens
Sabato's Crystal Ball provides another race-rating framework, using expert analysis to classify competitive contests rather than relying solely on a statistical probability. Like Cook, its value lies partly in the race-by-race context. Analysts can consider candidate developments, state political conditions and the broader electoral environment alongside polling. That means an expert rating can move even when the polling picture has not changed dramatically if analysts believe other factors have altered the competitiveness of a contest. The broader point is that expert ratings are designed to communicate the state of individual races in a relatively accessible way. They are not intended to function as trading prices or as the output of a single statistical simulation.
Why can all five disagree?
The biggest reason is simple: they are not measuring the same thing. A poll measures voter sentiment at a particular point in time. A prediction market measures the price traders are willing to put on a future outcome. A statistical model processes multiple data sources and simulates thousands of possible elections. An expert rating assesses the competitiveness of individual races.
There is also a difference in how uncertainty is treated. Suppose several Senate races are polling within a few points. A model may simulate those races thousands of times and calculate how often each party reaches a particular seat threshold. A prediction market may assign a price to Senate control based on traders' collective expectations.
Cook may simply classify several of those races as Toss Ups. All three can therefore be describing the same underlying uncertainty without producing the same number.
So which number should voters look at?
There is no single number that answers every question. If the question is what are traders pricing right now?, prediction markets provide that information. If the question is what does a statistical model calculate after combining polling and other indicators?, FLIPR provides a model-based answer. If the question is which individual races are considered competitive?, Cook and Sabato provide race-rating frameworks.
And if the question is where voters currently stand, polling remains the direct measure of voter sentiment, although polls themselves carry sampling and methodological uncertainty. The most useful way to read the 2026 election landscape, therefore, may be to understand what each system is actually designed to measure rather than treating them as competing versions of the same forecast.
With Election Day approaching on November 3, market prices can continue moving, new polls can change averages, models can update their simulations and race ratings can shift as campaigns develop. The disagreement between them is not necessarily a flaw. It is a reminder that an election is not a single number, and that different tools can turn the same political information into different measures of uncertainty.