WTC Points Table 2025-27: Where does India stand after Sri Lanka draw?

&imwidth=600&imheight=450&format=webp&quality=medium "WTC Points Table 2025-27: Where does India stand after Sri Lanka draw?")
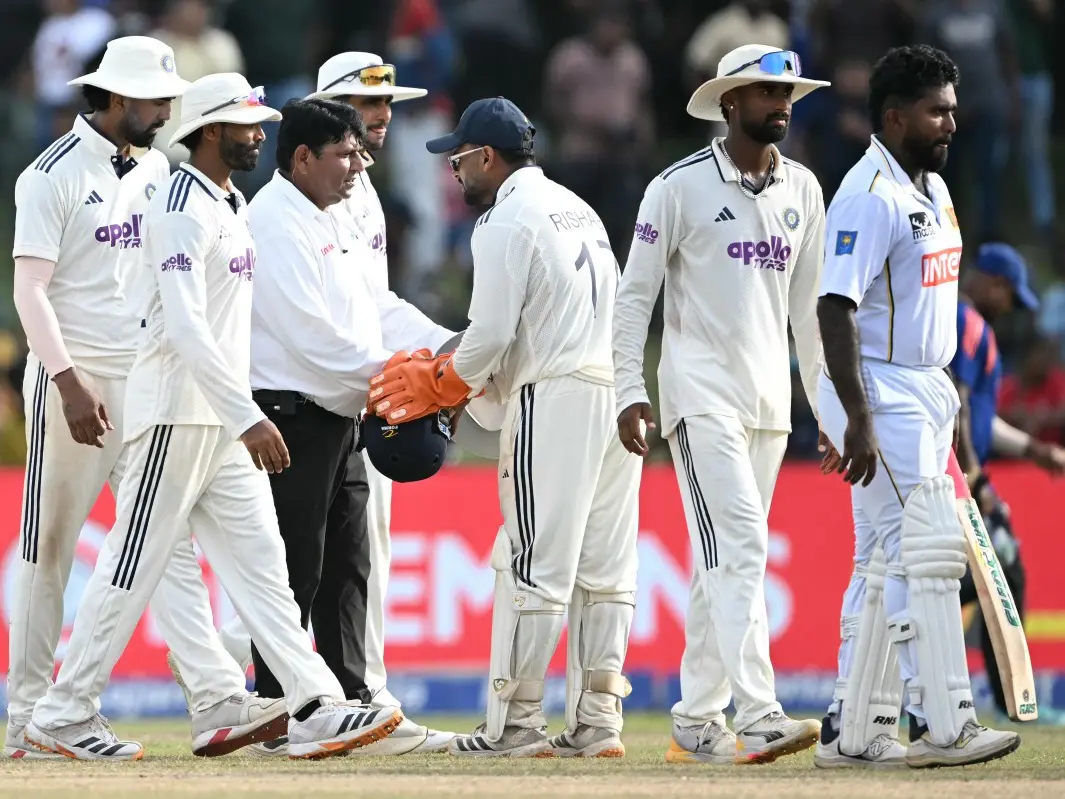
India's Rishabh Pant shakes hands with the umpire Photograph: (AFP)
Check the updated ICC World Test Championship (WTC) points table after India were held to a draw by Sri Lanka in the second Test in Colombo despite enforcing the follow-on.
India’s hopes of reaching the 2025-27 World Test Championship (WTC) final suffered a setback after the second Test against Sri Lanka ended in a draw in Colombo on Thursday (Aug 27). The result left India fifth in the WTC standings with five wins and 68 points and their points percentage (PCT) also fell from 53.33 to 51.52.
Australia remain at the top of the table after beating Bangladesh in the second Test at Mackay. The victory took their PCT to 80.00.
Defending champions South Africa are second with 75.00, having won three of their four Tests. New Zealand are third with 72.22 after losing just one of their six matches.
Bangladesh are fourth with a PCT of 55.56 following their heavy defeat to Australia. India are fifth on 51.52, while Sri Lanka are sixth with 33.33 after winning only one of their six Tests.
England sit seventh with a PCT of 29.76. They have played 14 Tests, the most among all teams, winning five and losing eight. Their campaign has also been affected by a 14-point deduction for slow over rates.
Pakistan are at the bottom with a PCT of 19.05 after their innings-and-103-run defeat to England in the first Test at Headingley.
Trending Stories
&im=FitAndFill=(700,400)&imwidth=280&imheight=210&format=webp&quality=medium)
&imwidth=280&imheight=210&format=webp&quality=medium)
&imwidth=280&imheight=210&format=webp&quality=medium)
&imwidth=280&imheight=210&format=webp&quality=medium)
&im=FitAndFill=(700,400)&imwidth=280&imheight=210&format=webp&quality=medium)
&imwidth=280&imheight=210&format=webp&quality=medium)
&imwidth=280&imheight=210&format=webp&quality=medium)
&imwidth=280&imheight=210&format=webp&quality=medium)
&imwidth=280&imheight=210&format=webp&quality=medium)
&imwidth=280&imheight=210&format=webp&quality=medium)
&imwidth=280&imheight=210&format=webp&quality=medium)
&imwidth=280&imheight=210&format=webp&quality=medium)
&imwidth=280&imheight=210&format=webp&quality=medium)
&imwidth=280&imheight=210&format=webp&quality=medium)
&imwidth=280&imheight=210&format=webp&quality=medium)
&imwidth=280&imheight=210&format=webp&quality=medium)
&imwidth=280&imheight=210&format=webp&quality=medium)
&imwidth=280&imheight=210&format=webp&quality=medium)
&imwidth=280&imheight=210&format=webp&quality=medium)
&imwidth=280&imheight=210&format=webp&quality=medium)
&imwidth=280&imheight=210&format=webp&quality=medium)
&imwidth=280&imheight=210&format=webp&quality=medium)
&imwidth=280&imheight=210&format=webp&quality=medium)
&imwidth=280&imheight=210&format=webp&quality=medium)
&imwidth=280&imheight=210&format=webp&quality=medium)
&imwidth=280&imheight=210&format=webp&quality=medium)
&imwidth=280&imheight=210&format=webp&quality=medium)
&imwidth=280&imheight=210&format=webp&quality=medium)
&imwidth=280&imheight=210&format=webp&quality=medium)
&imwidth=280&imheight=210&format=webp&quality=medium)
&imwidth=280&imheight=210&format=webp&quality=medium)
&imwidth=280&imheight=210&format=webp&quality=medium)
&imwidth=280&imheight=210&format=webp&quality=medium)
&imwidth=280&imheight=210&format=webp&quality=medium)
&imwidth=280&imheight=210&format=webp&quality=medium)
Also Read - IND vs SL, 2nd Test: Sonal Dinusha achieves rare feat with second century after follow-on
West Indies are eighth with 20.83. They have won only two of their 12 Tests and have also lost two points due to over-rate offences.
India will next travel to New Zealand for a two-Test series in Nov before hosting Australia for a five-Test series in early 2027.
India will need a strong run of results in these seven matches to stay in the race for the WTC final. However, the challenge will be tough, especially against New Zealand and Australia.
India’s last Test series against New Zealand ended in a 3-0 defeat, giving the Black Caps India’s first home Test series loss in 12 years.
World Test Championship 2025-27 points table
| Team | M | W | L | D | Deduction | Pts | PCT |
|---|---|---|---|---|---|---|---|
| Australia | 10 | 8 | 2 | 0 | 0 | 96 | 80 |
| South Africa | 4 | 3 | 1 | 0 | 0 | 36 | 75 |
| New Zealand | 6 | 4 | 1 | 0 | 0 | 52 | 72.22 |
| Bangladesh | 6 | 3 | 2 | 1 | 0 | 40 | 55.56 |
| India | 11 | 5 | 4 | 2 | 0 | 68 | 51.52 |
| Sri Lanka | 6 | 1 | 2 | 3 | 0 | 24 | 33.33 |
| England | 14 | 5 | 8 | 1 | 14 | 50 | 29.76 |
| West Indies | 12 | 2 | 8 | 2 | 8 | 30 | 20.83 |
| Pakistan | 7 | 2 | 5 | 0 | 2 | 16 | 19.05 |