Nirmala Sitharaman tables Economic Survey 2025-26 in Parliament ahead of Union Budget on Feb 1

&imwidth=600&imheight=450&format=webp&quality=medium "Nirmala Sitharaman tables Economic Survey 2025-26 in Parliament ahead of Union Budget on Feb 1")
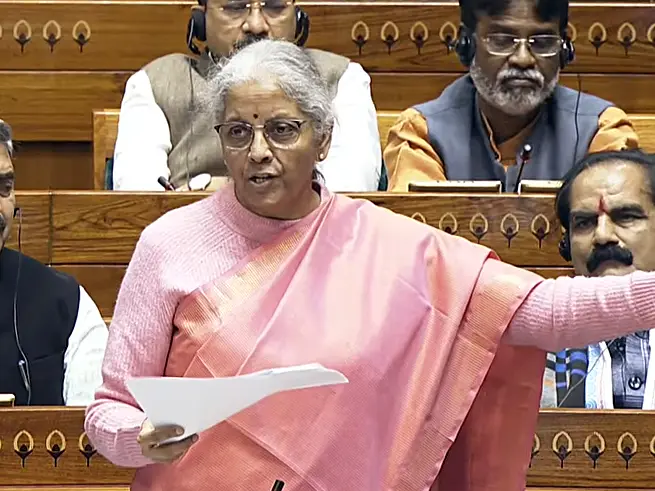
File Photo: Union Finance Minister Nirmala Sitharaman Photograph: (ANI)
Nirmala Sitharaman tables Economic Survey 2025-26 in Parliament ahead of Union Budget on Feb 1
Indian Union Finance Minister Nirmala Sitharaman tabled the Economic Survey in Parliament on Thursday (Jan 29), formally kicking off the countdown to the Union Budget. The Budget will be presented on Sunday, February 1, and will mark Sitharaman's ninth consecutive Budget, a record in itself. As always, the Survey comes first. It is the government’s way of laying out the state of the economy before announcing how it plans to tax, spend and reform it.
The economy's report card: What is the Economic Survey?
The Economic Survey is often described as India’s annual "report card". It offers a data-heavy review of how the economy performed over the past year and sets the tone for what lies ahead. While the Budget focuses on future decisions, the Survey explains the past, what worked, what did not, and where the risks lie. In practical terms, it gives policymakers and lawmakers the context behind the numbers that will appear in the Budget speech.
Who prepares it
The Survey is prepared by the Economic Division of the Department of Economic Affairs under the Chief Economic Adviser. It is released in two parts, each serving a different purpose. One looks forward. The other looks back.
Trending Stories
)
)
)
)
)
)
)
)
&im=FitAndFill=(700,400))
)
)
)
)
)
)
)
)
)
)
)
)
)
)
)
)
)
)
)
)
)
)
)
)
&im=FitAndFill=(700,400))
)
What Part 1 covers
Part 1, also called Volume 1, is the big picture section. It provides a macroeconomic overview and a forward-looking assessment of the Indian economy. This is where the government lays out its narrative on growth, inflation, fiscal health and external trade.
The section includes analysis of GDP growth, inflation trends using CPI and WPI, fiscal deficit levels and the balance of trade. It also flags structural issues and policy challenges, and offers recommendations on reforms needed to sustain growth. This part is meant to shape the policy mood for the year ahead.
What Part 2 focuses on
Part 2 is more granular and data-driven. It breaks down performance across individual sectors like agriculture, industry, services and infrastructure. It also looks at social indicators, including health, education, poverty and climate-related risks.
This section is packed with data, charts and tables, and is often used by researchers and economists to track long-term trends.
Why it matters
The tabling of the Economic Survey is not just a formality. It is the final checkpoint before the Budget, giving a snapshot of where the economy stands and what pressures the government is working with. Growth numbers, inflation trends and fiscal constraints outlined here often shape the tone and limits of the Budget itself.
In short, the Survey tells you how the economy is doing. The Budget tells you what the government plans to do about it.