

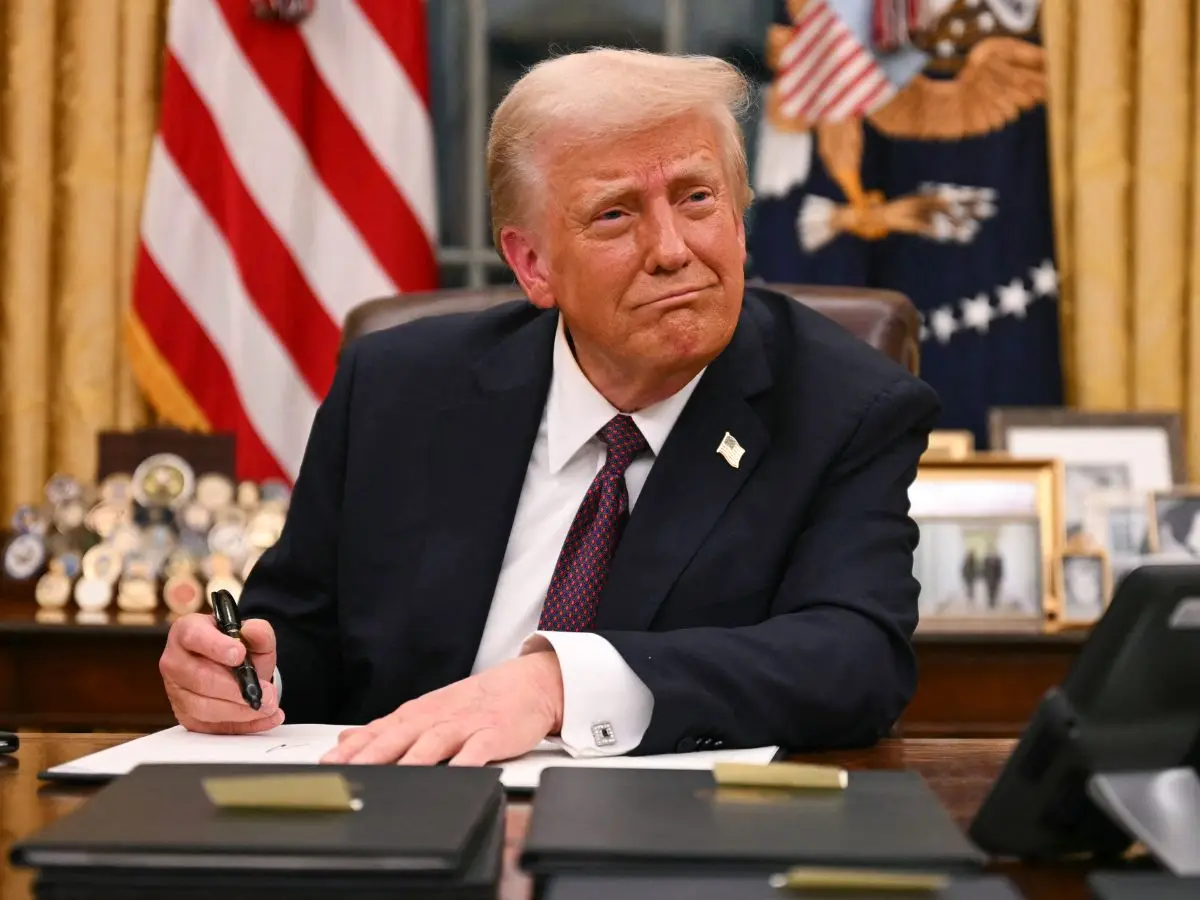
&imwidth=800&imheight=600&format=webp&quality=medium "Trump stock trades under focus as disclosures show active market participation")
Financial disclosures linked to Donald Trump have revealed large-scale stock market activity during the first quarter of 2026, raising questions about how policy decisions and financial markets may intersect.
According to official filings released in May, the disclosures show around 3,600 to 3,700 stock and ETF transactions between January and March. The total reported value of these trades is estimated to be between $220 million and $750 million, based on broad ranges provided in the forms.
Large-scale trading across sectors
The filings show that the portfolio included a mix of purchases and sales, with buying activity generally higher than selling. Much of the trading was carried out through managed accounts linked to family trusts, where brokers may have executed trades on behalf of the account holders. The data points to significant activity in sectors such as technology, artificial intelligence, defence and financial services. These sectors are often influenced by government policies, including trade decisions, regulation and public spending.
Key stocks and sectors in focus
The disclosures indicate investments in major technology companies and semiconductor firms. Stocks linked to artificial intelligence and chip manufacturing saw notable buying activity, including companies such as Nvidia and Apple. At the same time, there were large sales in companies like Microsoft, Amazon and Meta, even though exposure to big technology firms remained strong overall.
Trending Stories
&imwidth=180&imheight=135&format=webp&quality=medium)
Pakistan to head IMF, World Bank boards after 74 years amid persistent economic crisis
&imwidth=180&imheight=135&format=webp&quality=medium)
IND-W vs ZIM-W, 1st T20I: Deepti Sharma, Niki Prasad shine as India beat Zimbabwe by four wickets
&imwidth=180&imheight=135&format=webp&quality=medium)
US midterms 2026: Ken Paxton may have Elon Musk to thank if he wins the Texas Senate race. Here's why
&imwidth=180&imheight=135&format=webp&quality=medium)
Trump invokes national interest to waive new Russia sanctions, tariffs; India gets relief from 100% tariff threat
&imwidth=180&imheight=135&format=webp&quality=medium)
Ankita Bhandari murder case: Parents meet CBI, seek impartial investigation
&imwidth=180&imheight=135&format=webp&quality=medium)
Lizard people? Ex-US Army sniper claims soldier killed by 'reptilian beings' in battle near Area 51
&imwidth=180&imheight=135&format=webp&quality=medium)
Gravitas | Iran threatens to hit key bridges in 7 countries if US resumes strikes
&imwidth=180&imheight=135&format=webp&quality=medium)
Ukraine drone strike disrupts 22 Russian airports, over 200 flights

Not Khan but Pal: Why did Imran Khan choose his mother's surname over his father's? Family tree explained
&imwidth=180&imheight=135&format=webp&quality=medium)
A secret code, a midnight escape and 300 deaths: The Russian officer who turned on Putin
&imwidth=180&imheight=135&format=webp&quality=medium)
'Reason UN has lost credibility': Amid SIR protests India hits out at report alleging 'youth repression'
&imwidth=180&imheight=135&format=webp&quality=medium)
Oregon school shooting: 16-year-old shooter identified, used shotgun bought by mother; Trump praises bystander who shot gunman as 'great hero'
&imwidth=180&imheight=135&format=webp&quality=medium)
‘My president, I mean my husband’: Trump's new press secretary Katie Zacharia's first briefing goes off the rails in 14 minutes
&imwidth=180&imheight=135&format=webp&quality=medium)
China responds to Trump's Press Secretary Katie Zacharia after toilet remark: 'Visit China more often'
&im=FitAndFill=(700,400)&imwidth=180&imheight=135&format=webp&quality=medium)
Who left the White House podium the fastest? Press secretaries with the shortest stints
&imwidth=180&imheight=135&format=webp&quality=medium)
COVID-19 pandemic led to increase in divorce cases, observes Madras High Court
&imwidth=180&imheight=135&format=webp&quality=medium)
Vijay Deverakonda and Rashmika Mandanna's Ranabaali X Review: Netizens call it history-rich but overstuffed
&imwidth=180&imheight=135&format=webp&quality=medium)
Ramayana Part 1: Sai Pallavi's warrior avatar as Sita steals the spotlight in new BTS footage
&imwidth=180&imheight=135&format=webp&quality=medium)
Israel examines Russia's Shahed-type drones sent by Ukraine to combat Iran | Gravitas
&imwidth=180&imheight=135&format=webp&quality=medium)
US midterms 2026: Alexandria Ocasio-Cortez donates $1 million to Abdul El-Sayed’s as Michigan race heats up
&imwidth=180&imheight=135&format=webp&quality=medium)
Infiltration bid foiled in Kupwara’s Keran sector, search operation underway
&imwidth=180&imheight=135&format=webp&quality=medium)
Here’s who is eyeing the White House press secretary role after Katie Zacharia’s exit
&imwidth=180&imheight=135&format=webp&quality=medium)
Sean ‘Diddy’ Combs transferred to new prison amid reports of special privileges
&imwidth=180&imheight=135&format=webp&quality=medium)
Abhishek Sharma sets all-time record for most T20I sixes in a year
&imwidth=180&imheight=135&format=webp&quality=medium)
No Ravindra Jadeja, Yashasvi Jaiswal in India’s 2027 ODI World Cup plans: Report
&im=FitAndFill=(700,400)&imwidth=180&imheight=135&format=webp&quality=medium)
Inside Tesla's Roadster: 10 features of Elon Musk's 'flying car' that push the limits of electric vehicles | In Pics
&im=FitAndFill=(700,400)&imwidth=180&imheight=135&format=webp&quality=medium)
New Friday OTT releases (October 16, 2026): DC, Sacrifice, Aasha- 6 new movies and TV shows coming on Netflix, Zee 5, Prime Video and more
&imwidth=180&imheight=135&format=webp&quality=medium)
One species, two lineages: Why Sri Lanka’s spectacled cobra differs genetically from Indian variant
&imwidth=180&imheight=135&format=webp&quality=medium)
Oil tanker carrying over 2M barrels of crude hits mine in Strait of Hormuz, catches fire, says Iran
&imwidth=180&imheight=135&format=webp&quality=medium)
Selma Blair’s team responds to flight incident, says actress ‘did not intend to harm anyone’
&imwidth=180&imheight=135&format=webp&quality=medium)
'We feel like Mr India': Gujarat’s undercover SHE team guard garba nights at Navratri

US ends automatic work permit extensions; Indian workers lose 540-day safety net: What it means
&imwidth=180&imheight=135&format=webp&quality=medium)
US lawmaker Pramila Jaypal writes to Rubio, urges to raise handling of CJP protest with India
Other areas of activity included:
Defence and aerospace companies such as Boeing and Palantir
Financial institutions including Bank of America and Goldman Sachs
Broad market exposure through S&P 500 index funds and exchange-traded funds
This mix suggests a diversified approach, with investments spread across sectors tied to economic growth and government policy.
Policy announcements and market movements
During the period covered by the disclosures, several policy announcements influenced market behaviour. Decisions related to tariffs, trade negotiations and international relations contributed to both market gains and declines. For example, tariff-related announcements were followed by market volatility, while pauses or adjustments in policy often led to broader market rallies.
Analysts note that some of the sectors included in the portfolio, particularly technology and defence, tend to respond quickly to such developments.
Questions around timing and transparency
The scale and timing of the trading activity have led to discussions among analysts and policymakers. While the disclosures provide insight into overall activity, they do not confirm whether individual trades were directly ordered by the president. Many transactions are listed as being handled by brokers or managed through trusts. This makes it difficult to determine the exact decision-making process behind each trade.
In addition, the filings do not include exact transaction dates, prices or profits, as they are reported in value ranges.
Limitations of the disclosure data
Experts highlight several limitations in the data:
Transactions are reported in broad value ranges
Exact timing of trades is not disclosed
Some trades may involve different financial instruments
Managed accounts reduce clarity on direct involvement
Because of these factors, the disclosures provide an overview rather than a complete picture of financial activity.
What this means for markets and governance
The filings show how closely investment patterns can align with sectors influenced by government policy. For investors, the data reflects broader trends in areas such as AI, defence and financial services. For policymakers and observers, the disclosures have renewed discussions around transparency and oversight in financial reporting for public officials. As more detailed reports become available later in the year, they may offer further clarity on how financial activity and policy decisions interact in practice.
